Extending WilmaScope

A developer’s guide to extending the WilmaScope 3D graph visualisation system

Tim Dwyer – 26th November 2004

Accurate for WilmaScope Version 3.1

Contents

Introduction

This document is intended as a rough guide for people who wish to use WilmaScope beyond simply interacting with the Graphical User Interface (GUI).  There are a number of ways that Wilma can be used by the adventurous, for example:

Nomenclature

Term
 Description
WILMA_HOME The directory in which WilmaScope has been installed, eg: "c:/Program Files/Wilma"
WILMA_CONSTANTS.properties The global properties file that WilmaScope loads at runtime.  Resides in WILMA_HOME/lib directory

Architecture

Wilma is a typical example of a Model-View-Controller (MVC) architecture (see Figure 1).  

WilmaScope MVC Architecture
Figure 1: MVC Architecture

That is to say, an effort has been made to separate:
A more detailed idea of how WilmaScope uses the MVC architecture is conveyed by Figure 2.

WilmaScope MVC Architecture
Figure 2a: WilmaScope MVC Architecture

These three conceptual components are realised in the WilmaScope architecture as follows:
The entities indicated within the controller component indicate some of the ways a user might interact with WilmaScope, or that a programmer might write extensions to construct or maintain a graph.  These are (see Figure 2b):
Different ways of using Wilma
Figure 2b: Different ways to use Wilma for custom applications

Conceptually, the graph model includes definitions of what we call Layout Engines.  A layout engine is an implementation of a layout algorithm.  That is, an automated system for finding positions for the elements of a graph in 3D space.  In practice the details of layout engines are completely separated from the graph data structures so that new layout engines can easily be created.  A more detailed view of WilmaScope’s internal architecture is shown in Figure 3

wilma classes
Figure 3: graph and view packages and example packages in which the various interfaces are implemented.

The classes in the forcelayout package are an example of an implementation of the LayoutEngine interface.  Several other layout engines have been implemented already and efforts have been made to simplify the task of creating new layout engines.  Classes implementing different graphical representations of graph elements (glyphs) must extend the relevant abstract class from the view package.  When such classes are placed in the viewplugin directory and added to the “Plugins” list in the WILMA_CONSTANTS.properties file they will be loaded at run-time.

Graph Model

The basic elements of a WilmaScope graph are nodes and edges.  The Node and Edge classes both implement the GraphElement interface which defines some general properties for how such elements are arranged or visualised.  WilmaScope supports recursive definitions for graphs: that is, clustered graphs.  This is realised in an object oriented design by making Cluster a subclass of node.  This means that clusters can be added or removed from a graph model in the same way as nodes.  The difference being that a cluster is itself a collection of nodes and edges.  An important thing to note is that the top-level graph is a cluster.

GraphControl Bridge

Knowledge of the details of the classes in the graph package is not generally required for programmers to implement applications using or extending WilmaScope.  Instead, the API methods for creating or updating a graph are provided by the GraphControl class.  GraphControl defines facades (or simplified classes) as inner classes: ie, GraphControl.Node, GraphControl.Edge and GraphControl.Cluster.  When a GraphControl object is instantiated a root cluster is created upon which a graph may be built.  As a basic example consider the following code fragment:

import org.wilmascope.control.GraphControl.Cluster;
import org.wilmascope.control.GraphControl.Node;
import org.wilmascope.control.GraphControl.Edge;
...
// add elements to an existing instance of graphControl

Cluster root = graphControl.getRootCluster();
Node a = root.addNode();
Node b = root.addNode();
root.addEdge(a,b);

We give more detailed examples of use of the API provided by the GraphControl class later.

Plug-ins for Generating Graphs

Wilma comes with a number of graph generators which create random or regular graphs for testing purposes.  Creating a new graph generator is probably the easiest way to begin experimenting with the WilmaScope API.  In this section we describe how the WilmaScope graph generator framework is designed and outline how to use it to create your own graph generator.

User Interface

The various graph generators are accessed by the user from the “Graph Generator Window” which is accessed by the user from the “File->Create Test Graph...” menu option as shown in Figure 4.

Opening Graph Generator Window
Figure 4: Accessing the graph generator window.

The main features of the Graph Generator Window (as shown in Figure 5) are:
 
The graph generator window
Figure 5: The Graph Generator window

The Graph Generator Framework

Base classes associated with the graph generator framework are found in the org.wilmascope.graphgen package.

GraphGenerator

The abstract GraphGenerator class is a boilerplate for building new graph generators.  It provides miscellaneous methods for generating graphs but also provides a set of abstract methods which must be implemented so that your graph generator can be loaded by WilmaScope.  The abstract methods which a new graph generator must implement are as follows:

GeneratorManager

The GeneratorManager class maintains a list of available graph generators.  If you create a new class based on GraphGenerator then add an entry for the fully qualified path name to the WILMA_HOME/lib/WILMA_CONSTANTS.properties file for the GeneratorPlugins property.  Your new class will then be loaded (assuming the directory where it resides is in the classpath) when you run Wilma.

Example – Random Graph Generator

As an example of an implementation of GraphGenerator look at the RandomGraphGenerator class.  Key things to note are:

Plug-ins for Modifying Existing Graphs and Clusters

Often it is useful to procedurally modify the structure of an existing graph or cluster.  Plug-ins for effecting this functionality are made possible by the GraphModifier framework.  A GraphModifier plug-in extends the org.wilmascope.graphmodifier.GraphModifier abstract class and must implement three methods:
The user can invoke one of these plugins either:
Modifying a cluster

As of writing this document WilmaScope includes the following graph modifier plug-ins (found in org.wilmascope.graphmodifier.plugin):

Plug-ins for Performing Graph/Cluster Analysis

The GraphAnalysis plug-in framework works in a similar way to GraphModifier plugins, but GraphAnalysis plug-ins are not expected to modify the structure or attributes of a graph directly.  Rather, they should set a property in nodes and edges corresponding to the name of the plugin (the string returned by the getName method) with a floating point value that can be mapped by other classes to visual attributes (for example, the VisualMapping classes defined in the org.wilmascope.graphanalysis package).

A graph analysis plug-in must extend the org.wilmascope.graphanalysis.GraphAnalysis class, implementing the getName and analyse methods.  As with GraphModifier getName simply returns a descriptive string.  The analyse method takes no argument.  Rather, you must use getCluster() to operate on the cluster in the analyse method.  For example:
/**
* Calculate degree centrality for each node, ie for node v in V:
* degreecentrality(v) = degree(v)/max(degree(w)|w in V)
*
* @author dwyer
*/
public class DegreeCentrality extends GraphAnalysis {

public String getName() {
return "Degree Centrality";
}

/*
* @see org.wilmascope.graphanalysis.GraphAnalysis#analyse(org.wilmascope.control.GraphControl.Cluster)
*/
public void analyse() {
int maxDegree = 0;
for (Node n : getCluster().getNodes()) {
int degree = n.getDegree();
if (degree > maxDegree) {
maxDegree = degree;
}
}
if (maxDegree > 0) {
for (Node n : getCluster().getNodes()) {
float degreeCentrality = (float) n.getDegree() / (float) maxDegree;
n.getProperties().setProperty(getName(), "" + degreeCentrality);
}
}
}
}
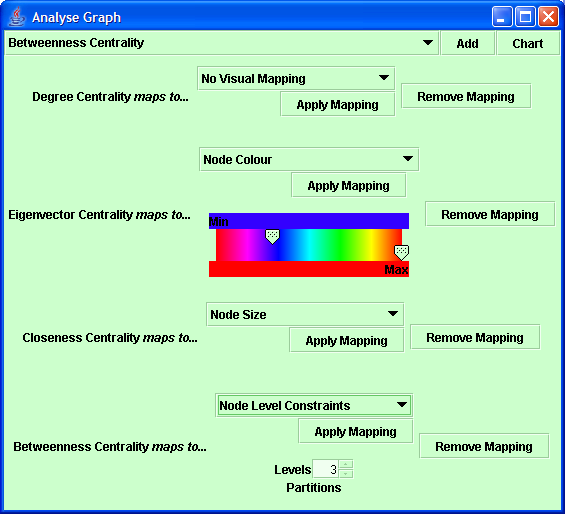
There is no need for a getControls method in GraphAnalysis plug-ins.  By default an instance of AnalysisPanel is created by the super class.  AnalysisPanel allows a user to choose visual mappings for the results of the analysis, and appears in the Graph Analysis window, shown below with a number of mappings defined for various analysis plugins:

analysis mappings example

File Formats

The easiest way to visualise graphs from other data sources is to convert them into a file format that WilmaScope understands and then simply to load them up using the File->Load menu option.  Here we describe supported file formats.

XML Wilma Graph (XWG) File Format

The most flexible way to load graphs into WilmaScope is to use Wilma's own internal file format, the XML Wilma Graph (XWG) file format.  Based on XML, XWG files are easily parsed and generated by XML libraries and tools.  As the Wilma internal format, it should support any of Wilma's functionality, including specifications for layout engines and view plugins.

XWG is based on a fairly straightforward DTD which can be found in the Wilma/data/WilmaGraph.dtd file, shown in Figure 7.  Note that this file should be present in any directory from which you wish to load XWG files into Wilma.

WilmaGraph.dtd
Figure 7: The WilmaGraph.dtd XWG definition

Note that the XWG format mirrors the structure of the Wilma graph model shown in Figure 3.  That is, clustered graphs are recursively defined where a graph is itself a cluster which may contain nodes, edges or other clusters.  Figure 8 shows an example of a very simple XWG file and Figure 9 shows how it looks loaded into Wilma.

A simple XWG file
Figure 8: A very simple XWG file.

What the simple XWG graph looks like in Wilma
Figure 9: The XWG file from Figure 8 loaded into Wilma.

The file shown in Figure 8 was created by hand.  When we save it back out to a file from WilmaScope more detail is recorded (for example, detail about the layout engine used and the view parameters for nodes and edges):

More detailed XWG file
Figure 10: The same graph but with more details specified.

Node Properties

Property Key
Values
Description
Position
Three floats separated by spaces
X Y Z position.  Values between 0 and 1 are a good start.
LevelConstraint
integer
constrains the z position to a plane specified by the integer when used with certain layout engines
FixedPosition
[True|null]
If this property is present with any string then the node's position will be fixed... ie, not affected by the layout

Edge Properties

Property Key
Values
Description
Weight
Float
Affects layout when used with certain layout engines.

Available ViewTypes

A ViewType entry requires a name.  This specifies the View plugin that will be loaded.  Some ViewPlugins that have been implemented are as follows (when entering the value for name in an XWG file spaces must appear exactly as below):

Nodes:

ViewPlugin name
Description
DefaultNodeView
Spherical node view.  Labels appear as floating banners.  For improved performance the number of faces shown are dependant on the distance from the camera.
Oriented Box Node
A box that always faces the viewer.  Labels are texture mapped onto the face.
LineNode
Use with LineEdge... the node itself is invisible but this node type ensures that the line edge colours are set according to the node colour
LabelOnly
Only the label is shown as a banner
Box Node
A box shaped node.  Labels are texture mapped onto the face.
SquareTube
A tube with square cross section and specified bottom and top dimensions
A tubular node
A tube with round cross section and specified bottom and top dimensions

Edges:

ViewPlugin name
Description
Plain Edge
Cylindrical edge.  For improved performance the number of faces shown are dependant on the distance from the camera.
Arrow
Arrow made out of a cylinder and a cone
LineEdge
Uses OpenGL (or DirectX) line segment primitive for super-fast rendering.  Lines colouring is smoothly graded from start node colour to end node colour if used with LineNode.
Directed Edge
Shows a directed edge with a little cone next to the edge.  Alternative to arrow.  Originally intended as a 3D analog for UML directed edges.
Attenuated Edge
An attenuated edge is tube that's fat at the ends and thin in the middle.  If my sloppy calculations are correct then the radius should match the radius of spherical nodes at either end.  Colour should also be graded from the start node colour to end node colour.
Inheritance
A 3D analogue for a UML inheritance edge.  Basically an arrow with a blue cylinder and a green cone at the start node.
Aggregation
A 3D analogue of the UML aggregation edge style.  Blue cylinder with red diamond on top.

Clusters:

ViewPlugin name
Description
Spherical Cluster
A semitransparent spherical bubble around the constituent nodes.  For improved performance the number of faces shown are dependant on the distance from the camera.
Box Cluster
Semitransparent box around constituent nodes.

Common ViewType properties

Common to all graph elements (Nodes, Edges and Clusters)

Property Key
Values
Description
Label
String
Text that will appear texture mapped onto or in a banner above the graph element
Visible
[True|False]
The graph element will not be rendered... eg, hidden edges can be useful
Colour
Three space separated floats between 0 and 1
Red, Green and Blue colour values

Common to all Nodes

Property Key
Values
Description
Radius
Float
Radius... 0.1 is good for spherical nodes.

Common to all Edges

Property Key
Values
Description
Radius
Float
Radius of edge cylinders.  0.02 works well with the DefaultEdgeView.

GML File Format

WilmaScope currently supports a very limited subset of the GML file format.  Better support is planned.

Leda Graph File Format

WilmaScope currently supports a very limited subset of the LEDA Graph File Format file format. Better support is planned.

Creating New Graph Element Glyphs

Creating New Layout Engines

To create a new layout engine plugin, a developer must extend the LayoutEngine abstract class, and also extend the NodeLayout and EdgeLayout abstract classes which are used to store any layout specific properties for nodes and edges.  For example, here is the code for the RandomLayout class:

package org.wilmascope.randomlayout;

import javax.swing.JPanel;

import org.wilmascope.global.RandomGenerator;
import org.wilmascope.graph.Edge;
import org.wilmascope.graph.EdgeLayout;
import org.wilmascope.graph.LayoutEngine;
import org.wilmascope.graph.Node;
import org.wilmascope.graph.NodeLayout;

/**
 * Assigns random positions to nodes. This is the simplest possible layout
 * algorithm I can think of. Use this as a starting point for creating your own
 * layout engines.
 *
 * @author dwyer
 */
public class RandomLayout extends LayoutEngine<RandomNode, RandomEdge> {

  /*
   * This method always returns true because this layout can be completed in one
   * step. An iterative algorithm could return false until complete.
   *
   * @see org.wilmascope.graph.LayoutEngine#applyLayout()
   */
  public boolean applyLayout() {
    for (Node n : getRoot().getNodes()) {
      n.setPosition(RandomGenerator.getPoint3f());
    }
    return true;
  }

  /*
   * Name to appear in the layout menu.
   *
   * @see org.wilmascope.graph.LayoutEngine#getName()
   */
  public String getName() {
    return "Random";
  }

  /*
   * called by super.init when layout instantiated
   *
   * @see org.wilmascope.graph.LayoutEngine#createNodeLayout(org.wilmascope.graph.Node)
   */
  public RandomNode createNodeLayout(Node n) {
    return new RandomNode();
  }

  /*
   * called by super.init when layout instantiated
   *
   * @see org.wilmascope.graph.LayoutEngine#createEdgeLayout(org.wilmascope.graph.Edge)
   */
  public RandomEdge createEdgeLayout(Edge e) {
    return new RandomEdge();
  }

  /*
   * Potentially we could create a control panel in the constructor to be
   * returned here. Such a control panel would allow the user to set various
   * layout properties.
   *
   * @see org.wilmascope.graph.LayoutEngine#getControls()
   */
  public JPanel getControls() {
    return new JPanel();
  }

}
/**
 * When the layout engine is instatiated, instances of this classes are assigned
 * to all nodes in the root cluster. You can store node data specific to your
 * layout in here.
 */
class RandomNode extends NodeLayout {
}

/**
 * When the layout engine is instatiated, instances of the following class are
 * assigned to all edges in the root cluster. You can store edge data specific
 * to your layout here.
 */
class RandomEdge extends EdgeLayout {
}


Once these classes have been defined and compiled you should add the fully qualified path for your LayoutEngine class to the WILMA_CONSTANTS.properties file, and optionally set it as the default layout, eg:
LayoutPlugins=org.wilmascope.forcelayout.ForceLayout,....,org.wilmascope.randomlayout.RandomLayout
DefaultLayout=Random
Then, run WilmaScope, ensuring the path to your new classes and your copy of the WILMA_CONSTANTS.properties file are added to the classpath, eg:
java -cp %PATH_TO_YOUR_COPY_OF_WILMA_CONSTANTS_FILE%;%PATH_TO_YOUR_LAYOUT_CLASS% 
-jar %WILMA_HOME%/lib/wilma.jar

Getting the WilmaScope Source Code

As discussed throughout this document, modifying the Wilma source code is not usually necessary to extend the system with plugins or to use it inside another application.  However, it may be useful to look at the source to find out how something works or to fix a bug that you can't wait for us to fix (if you do so, please send as details of the fix!). 

As of Version 3.0 the WilmaScope binary distribution includes source code in the WILMA_HOME/src directory.  However, it is recommended that you obtain the most recent source version by accessing the CVS repository.  The easiest way to do this is with the Eclipse IDE as follows:

Code Conventions